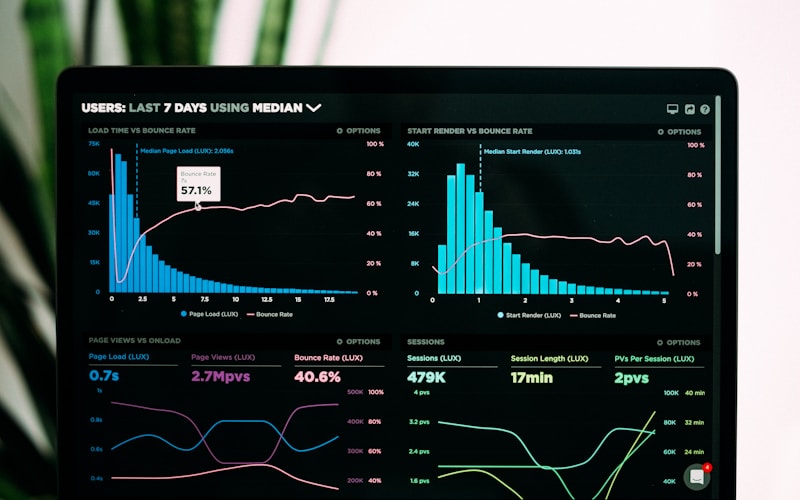
The Power of Data in Operations
Operations teams make hundreds of decisions every day: which issue needs attention first, where a service level is slipping, which outlet needs support, and which process is creating avoidable work. When those decisions are based on scattered spreadsheets or memory, good people spend too much time finding the story inside the numbers.
Data-driven operations does not mean building a complicated dashboard for every metric. It means creating a trusted view of the few signals that help a team act earlier and follow through.
Start With the Decision, Not the Chart
Ask what decision the report should improve. If the goal is to protect service quality, the useful fields may include volume, turnaround time, exception count, backlog, and owner. If the goal is growth, the view may focus on lead stage, conversion, follow-up age, and source quality.
Define the decision and its owner before choosing a visual. This keeps the dashboard practical and prevents the team from confusing more information with better control.
Create a Consistent Data Model
Across a large network, names and definitions drift quickly. One team may call a case closed when it is resolved; another may close it when it is simply assigned. Set shared definitions for dates, statuses, locations, owners, and service levels. Keep the source fields stable and document how each metric is calculated.
In a 551+ outlet operating environment, this discipline is what makes district comparisons meaningful. Without it, the dashboard only gives a polished view of inconsistent inputs.
Use Layers of Operational Visibility
A useful reporting system has three levels. The executive view shows direction and exceptions. The manager view explains where the change is happening. The working view gives the owner a list of actions with due dates and context.
These layers should connect. A red signal in the summary must lead to a district, an outlet, a case, or a process step that someone can investigate. If a user cannot move from signal to action, the visual is incomplete.
Turn Exceptions Into a Workflow
Reports become valuable when they trigger a repeatable response. Set thresholds for unusual volume, missed SLA, incomplete reporting, or sudden performance change. Route the exception to the right owner, record the explanation, and review whether the threshold still makes sense.
This closes the loop between measurement and improvement. It also creates a history of recurring issues that can guide process redesign instead of forcing the team to solve the same problem every month.
Make Reporting Part of the Operating Rhythm
A dashboard cannot replace a review habit. Set a simple rhythm: daily exception checks, weekly team reviews, and a monthly leadership summary. Each meeting should end with a small number of named actions, not a longer list of observations.
When data is trusted, visible, and connected to ownership, operations becomes easier to steer. Leaders see risk sooner, teams spend less time reconciling reports, and improvement work can be measured from one period to the next.